How to Read Stock Charts: A Beginner's Step-by-Step Guide
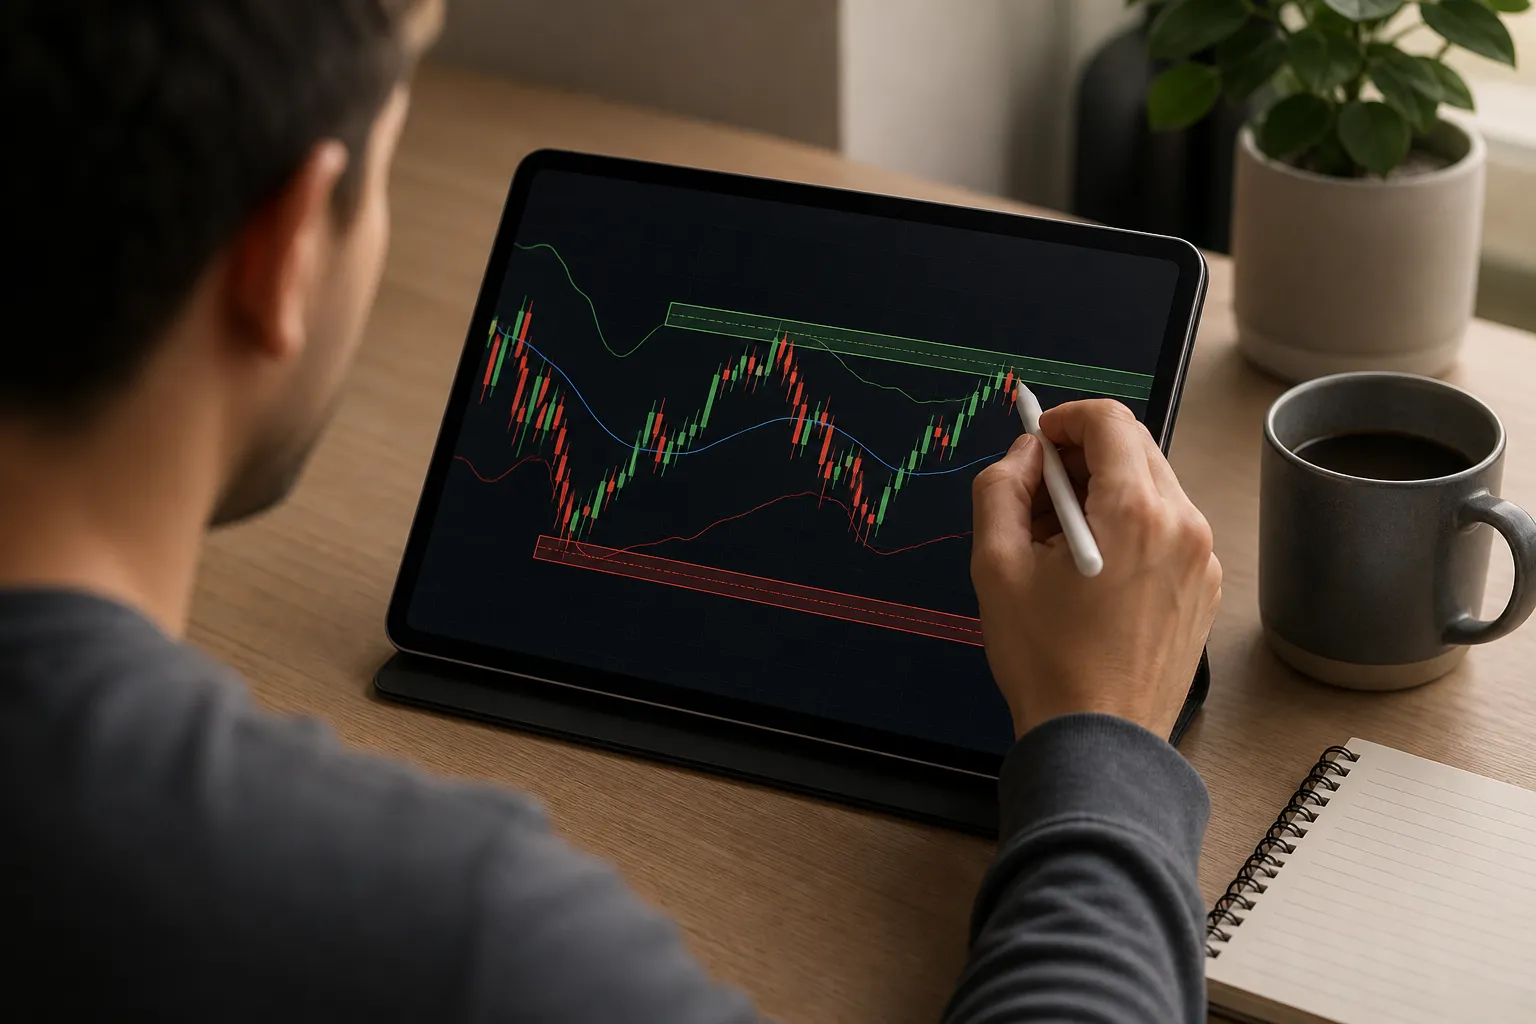
You do not need a stack of indicators to read a chart. If you can read candles, locate the trend, mark support and resistance, and track VWAP, you can plan entries, stops, and targets with intent. This guide lays out a simple order of operations and shows you how to practice on live charts so your decisions improve with each session.
Candles, timeframes, and price scales
What a candlestick shows
Each candlestick condenses a battle over one period. The body marks the open-to-close range, wicks mark the extremes. Green closes above the open, red closes below. Example: a 5-minute candle opens 100.00, trades down to 98.90, up to 104.20, and closes 103.10. The body spans 100.00 to 103.10, the wicks reach 98.90 and 104.20. That tells you buyers absorbed selling near 99 and finished the period in control near 103. When you see a series of small bodies with long wicks into the same area, that area is being defended. When you see range expansion (a candle larger than recent candles that pushes past a prior high or low), momentum is taking over.
Two quick context reads help: inside bars (a candle that stays within the prior candle’s range) signal compression, often before a break. Outside bars (a candle that engulfs the prior candle’s range) signal a shift in control. You do not need to memorize patterns. Focus on who is winning each interval and whether the range is expanding or contracting.
Line vs candles, and choosing a timeframe
Line charts connect closing prices, which filters intraperiod noise and makes swing direction obvious. Candles show the path within the period, which you need for timing. Use a line chart to map the bigger move, then switch to candles to plan the trade.
Match timeframe to holding period. Day traders often use a 1 to 5 minute chart for execution, a 15 to 60 minute chart for intraday context, and a daily chart to mark the main levels. Swing traders lean on daily for execution with weekly for context, sometimes checking a 4-hour to refine entries. Be consistent: set one primary timeframe to make decisions and one higher timeframe for context so you are not changing your mind with every zoom.
On TickerLists, you can view candlestick or line charts from 1-minute to weekly bars and include extended hours for US stocks to see pre-market and after-hours moves that often frame the next day’s plan.
Reading the price axis
The price axis is your ruler. Notice the increment size and compare each candle to recent candles. If most candles are 0.30 wide and you print a 1.20 candle through a prior high, that is meaningful. If price is making progress in cents instead of dollars after a big morning push, momentum is fading. Zoom in to manage risk around exact levels; zoom out to see where current price sits relative to last week’s range or the 52-week range. A draggable price axis makes it easy to isolate the zone you care about so you can judge risk and reward in actual dollars rather than guesses.
Spotting trends, support, and resistance
Trend structure
Trends are sequences. An uptrend is a rhythm of higher highs and higher lows. A downtrend is lower highs and lower lows. Draw a simple swing line across obvious pivot highs and lows. If pullbacks stay shallow and highs keep stepping up, trend is intact. If swings stop making progress and overlap, you are in a range. If a trendline breaks and price fails to reclaim it on a retest, momentum is shifting.
Use two checkpoints before you trade with trend:
- Is the higher timeframe aligned? For example, going long on a 5-minute uptrend is higher odds if the daily is also making higher lows into resistance rather than rejecting from it.
- Is the move stretched? If a morning run is already 3 times the average 5-minute candle size, wait for a pullback or consolidation before pressing.
Support and resistance
Support is where buyers previously absorbed supply. Resistance is where sellers previously absorbed demand. Find them by marking prior swing highs and lows, gap edges, and the bounds of consolidations. Treat levels as zones, not single pennies.
- Look left and draw horizontal lines at obvious reaction points. For intraday trades, mark prior day high (PDH) and prior day low (PDL). Many morning decisions form around those lines.
- Note clusters of long top wicks or bottom wicks. Repeated rejection usually marks a level worth planning around.
- Mark the opening range high/low (first 5 or 15 minutes) for a simple early pivot.
Plan with exact numbers. Suppose a stock is basing under 50.00 with repeated taps and PDH at 50.20. A valid long plan is a break and hold above 50.20, then a pullback that holds 50.00 to 50.10. Entry: 50.25 on a higher low. Invalidation: a 5-minute close back below 50.00. Target: next resistance near 51.20. Risk: 0.30 to try for 0.95 reward is a little over 3R. If the pullback loses 50.00 and cannot reclaim, stand down. Defined invalidation keeps losers small and repeatable.
Tools help you keep this organized. On TickerLists, you can click any price to set stock price alerts, or draw entry, stop, and target lines and drag to adjust them while seeing P/L at each level. That removes guesswork when candles move fast.
Using VWAP to frame intraday bias
VWAP is the volume-weighted average price for the session. It marks the day’s true average cost. Many intraday traders track it because institutions care about it when measuring execution quality. Above VWAP, the average long is in profit. Below VWAP, the average long is under water.
How to use it with intention:
- Add VWAP to your intraday chart and note the slope. A flat VWAP often means chop. A steady upward slope with price building higher lows above VWAP suggests sustained buying pressure, and the inverse for selling.
- Define bias by behavior, not hope. If the open drives above VWAP and pullbacks hold a higher low on 1 to 5 minute bars, favor long setups. If price opens below VWAP and every push stalls at or under it, favor shorts.
- Time entries near VWAP in trend. In an uptrend, buy a pullback that tags or narrowly front-runs VWAP and then prints a higher low. Invalidation is clear: a lower low that loses VWAP and fails to reclaim. Targets are prior highs or the next resistance zone.
On TickerLists, you can add a VWAP indicator with bands to see when price stretches far from the average and when it snaps back. Combine this with your support and resistance zones to avoid chasing extended moves.
Practicing on live charts with watchlists
Consistency comes from reps. Build a routine that gets you on live charts, forces you to label levels, and limits trades to your criteria. A good stock watchlist app makes this easier.
Build focused lists you can scan fast
Start with liquid names and ETFs so spreads and slippage stay tight. Practical filters: average daily volume above 2 million shares, a daily ATR that is meaningful for your account size, and a clear catalyst list (earnings, guidance, product events, macro data). Add a crypto list if you track BTC, ETH, and majors so you can review overnight price action before the equity open.
Use sections to group by sector, theme, or setup to reduce context switching. On TickerLists, you can create unlimited watchlists with up to 200 symbols each, group them into foldable sections, drag to reorder, sort columns, and quick-switch with one key. If you used TradingView before, you can import TradingView exports with sections instead of rebuilding from scratch.
Use layouts and alerts to reduce misses
When you flip between timeframes and tickers, context gets lost. Multi-chart layouts fix that. On TickerLists, you can display one, two, or four charts on screen and save them as layouts. Keep a daily chart next to a 5-minute so you always see the bigger level you are trading against. Set stock price alerts at PDH/PDL, the opening range high/low, VWAP, and key swing points so you do not babysit every ticker. Live quotes include pre-market and after-hours for US stocks, and market data is real-time or delayed depending on the exchange, so you can follow moves as they develop.
Round out context with company data and a quick check
Before you act, scan basic stats. Day range and 52-week range tell you if today is exceptional or normal. Volume vs average volume tells you if participation supports the move. Market cap and P/E help you compare peers. The next earnings date and latest news tell you whether an unexpected headline might change your plan. On TickerLists you can see these on the same screen. If you want a starting point for intraday planning, the entry check and odds feature analyzes today’s 1-minute chart and suggests an entry, stop, target, and the odds the target is reached first. Treat it as a reference, then confirm with your own levels.
Keep reps simple and review them
Pick one setup and get reps. For example, a VWAP hold with higher lows into PDH. Each morning, scan your lists, mark support and resistance, and set alerts. When an alert fires, check trend structure, VWAP, and volume, then take the trade only if it matches your plan. After the close, screenshot your chart with the levels you traded and annotate what you saw, what you did, and what you will do next time. If you record short recap videos of your chart practice, SubtitlesFast can add and style subtitles so your notes are clear before you share them with a study group.
If you want a TradingView alternative
Some traders want a focused workspace for live stock charts, watchlists, VWAP, and simple alerts without a heavy build. TickerLists covers stocks, ETFs, indices, futures, forex, and crypto, saves your lists, alerts, levels, and layouts to your account, and syncs them across devices. Phone-friendly charts with pinch-to-zoom make quick checks easy when you are away from the desk.
Key takeaways
- Read candles for control and range expansion, then step back to confirm the trend across timeframes.
- Mark support and resistance as zones, plan trades with exact numbers, and define invalidation before entry.
- Use VWAP to frame intraday bias and time pullbacks in line with the session’s pressure.
- Practice on live charts with organized watchlists, layouts, and alerts so you act on signals, not noise.
- Review with screenshots or short videos to tighten rules. Simplicity and repetition beat complexity.
FAQ
What is the simplest way to start reading stock charts?
Begin with daily candles. Mark obvious support and resistance, then identify if price is trending or ranging. Only then drop to a lower timeframe for entries.
Which timeframe should a beginner use for trading?
Match timeframe to your holding period. Swing traders focus on daily and weekly charts. Intraday traders use 1 to 15 minutes for timing and a higher timeframe for context.
How does VWAP help day traders?
VWAP shows the day’s volume-weighted average price. Holding above it often signals buyer control, while holding below signals seller control. It helps frame intraday bias.
Do I need real-time data to learn chart reading?
No. You can learn structure, levels, and setups with delayed data. Real-time quotes help with execution once you start trading live.
How do I use alerts without overtrading?
Set alerts only at key levels that would change your decision. When an alert fires, recheck trend, VWAP, and volume before acting, instead of chasing every move.