Forex Live Quotes: Sources, Latency, Sessions, and Alerts
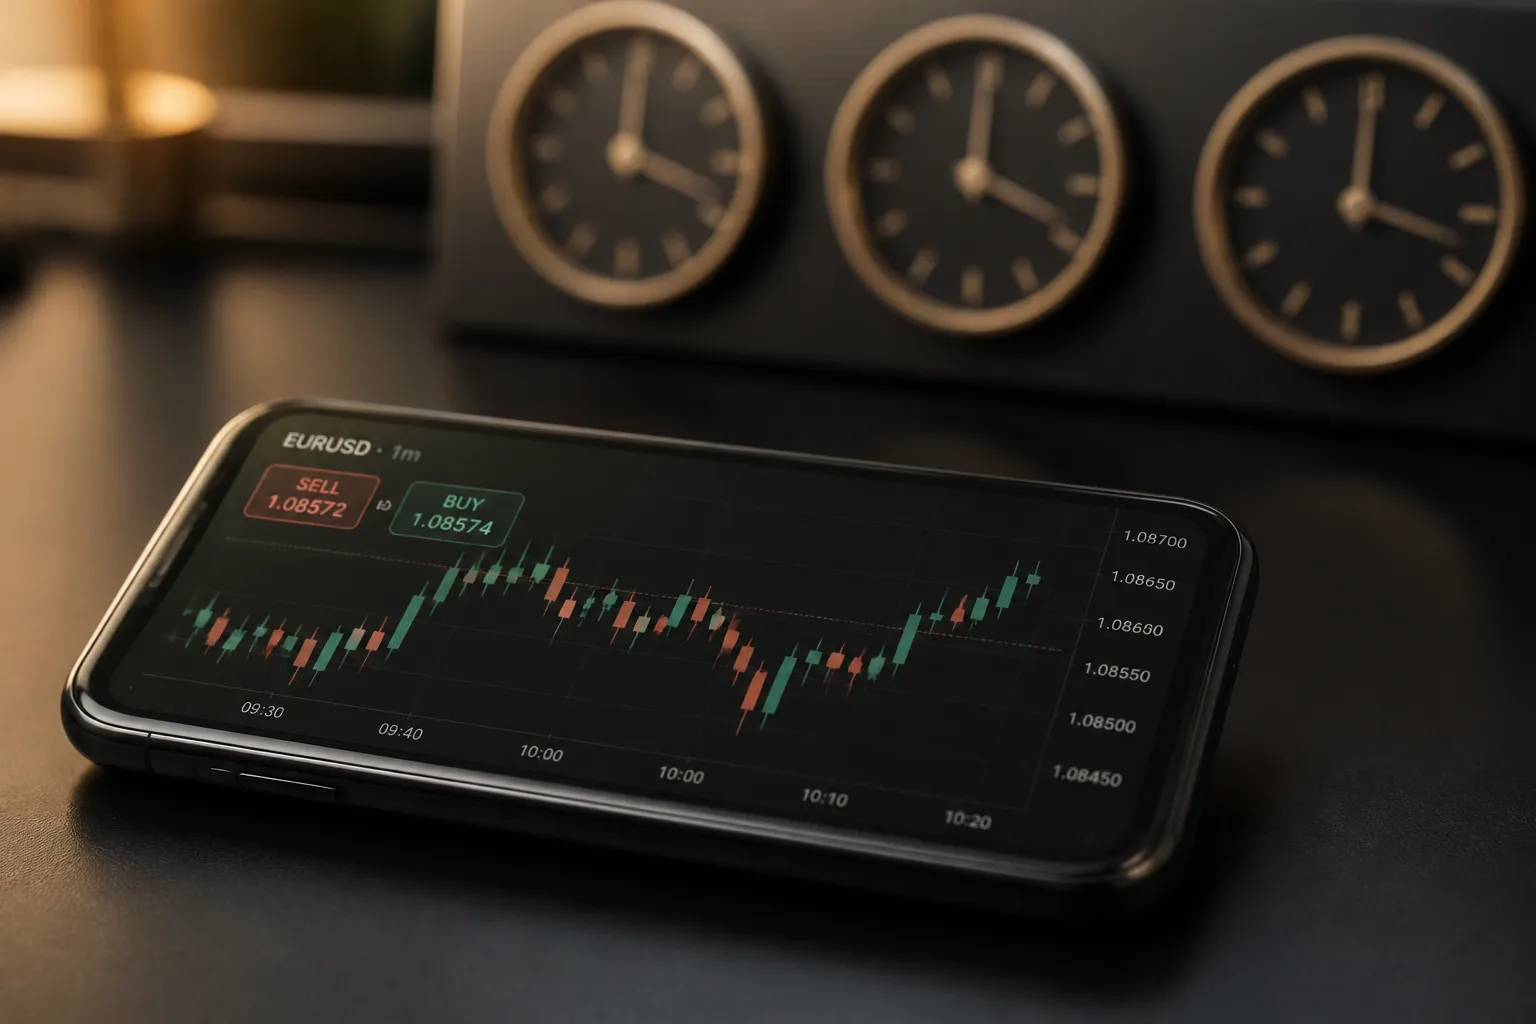
You open three platforms and see three different EURUSD prices. Which one is right? In spot FX, all of them can be right. Each feed reflects a different mix of liquidity, timing, and markups. If you trade around session opens or news, knowing how quotes are built and how latency shows up will help you trust your screen and act on time.
Definition: Forex live quotes are continuously updated bid and ask prices for currency pairs during the 24-hour trading week. Depending on the provider, they can be real time or delayed by a set interval. The spread is the difference between bid and ask, quoted in pips or fractional pips (pipettes).
How forex live quotes are sourced and why feeds differ
There is no central FX exchange. Prices form across a network of banks, non-bank liquidity providers, ECNs, and brokers. A retail platform typically aggregates quotes from one or more sources and displays the top-of-book bid and ask you can trade against.
- Liquidity pools. Bank and non-bank LPs stream firm two-way prices to ECNs and brokers. A feed built on one pool can differ by 0.1 to 1.0 pip from a feed built on another, especially in fast markets.
- Aggregation rules. Vendors merge streams differently. Some show the single best bid and ask. Others smooth outliers, apply minimum spread rules, or weight certain LPs more heavily to avoid flicker.
- Broker markups and commissions. Retail brokers can widen the spread slightly instead of charging commission, or quote raw spreads plus a per-trade fee. The same underlying market can look tighter or wider depending on this model.
- Quote conventions. Most majors print 5 decimals (pipettes), JPY pairs often show 3. Some platforms display mid-price, some highlight the bid, others the ask. Algos that trigger on the wrong side of the market can misfire, so know what your alerts reference.
- Rollover and maintenance. Around 5 pm New York (rollover), spreads often widen and quotes update less smoothly while swaps are applied and LPs refresh books. Expect a few minutes of choppy pricing.
How to judge a feed in practice: look at the median spread at quiet times versus during events, the stability of the quote during fast moves, and the frequency of updates. If your strategy depends on tight triggers, anchor alerts and decisions to the same feed you use to execute.
Real time, delayed, and latency you will actually see
Real time means your vendor pushes updates as they receive them. Delayed means quotes are held for a fixed interval before release. In retail FX, data is often effectively real time, but cross-asset dashboards sometimes mix delayed and live sources, so double-check labels.
Latency is the time from a price change at the source to when you see it. It stacks up across network hops, vendor processing, and your device.
- Normal conditions. 50 to 200 ms to major hubs is common on wired connections. On busy Wi-Fi or mobile, 300 to 800 ms is more typical.
- Heavy traffic. Around big data releases or thin liquidity, queues can build. You might see bursts of ticks after a brief stall, or updates that are 1 to 2 seconds behind.
- What you can control. Use wired internet when possible, keep your platform connected by WebSocket rather than frequent HTTP polling, run fewer background apps, and choose servers that are regionally close to your LPs when the platform allows.
- How to measure. Watch for quote staleness indicators, tick timestamps, or simply compare the last two decimals of a highly liquid pair like EURUSD across two feeds at the same time of day for a week. You will learn both average skew and how feeds behave under stress.
Sessions and timeframes that matter
FX runs from the Sunday open to the Friday close, but liquidity and volatility change with the clock. Quotes will feel faster or stickier depending on session and event risk.
- Asia (Sydney and Tokyo). Quieter in EUR and GBP, more active in JPY and AUD crosses. Typical spreads are steady outside of local data. Many days set the initial range here.
- London. Liquidity jumps near the London open. Spreads tighten and ranges expand on EUR and GBP majors. Many breakouts start with a stop run then a directional move.
- New York. The London - New York overlap is the most active window. US releases at 8:30 ET (NFP, CPI, PPI, retail sales) and 10:00 ET (ISM) can cause sharp repricing and temporary spread widening.
- Rollover. Around 5:00 pm New York, books refresh and swaps are applied. Spreads can widen several pips for a few minutes even in majors, then normalize.
Daylight saving shifts change the overlaps for a few weeks each spring and autumn. Mark the dates for the UK and US so your alert windows still line up with the real action.
Choosing timeframes that match your decisions
Match update speed to your holding period. Scalpers watch tick and 1-minute charts to manage entries around micro-structure and spread. Intraday swing traders tend to focus on 5-minute to hourly bars. Position traders emphasize daily and weekly closes. For breakout tracking, a 1-minute stream helps you spot the first pullback after the level breaks; for swing decisions, an hourly close carries more weight than a flurry of ticks.
VWAP is useful intraday if you anchor it to a session open. Viewing price relative to VWAP and its bands can help separate momentum from noise, especially during London and the overlap.
Build a forex watchlist that surfaces setups
A clean watchlist keeps the right pairs in view and hides the rest until they matter. Treat it like your trading bench. Split majors, minors, and exotics into foldable sections. Pin likely drivers for the day at the top based on the calendar and overnight ranges.
- Majors. EURUSD, GBPUSD, USDJPY, USDCHF.
- Commodity USD pairs. AUDUSD, NZDUSD, USDCAD.
- Crosses. EURJPY, EURGBP, AUDJPY, GBPNZD, etc.
- Exotics when relevant. USDZAR, USDTRY, USDMXN, USDSEK.
Daily workflow ideas: mark prior day high/low and current session high/low on your charts, tag pairs with expanding ranges, and promote the top movers to a “Today” section. Sorting by daily range, percentage move, or spread can surface opportunity quickly.
TickerLists covers forex with real-time or delayed data by source. You can view candlestick or line charts from 1-minute to weekly bars, add VWAP with bands, display one, two or four charts at once, and save them as layouts. Create unlimited watchlists with foldable sections, import TradingView exports with sections, and sync your lists, alerts, levels, and layouts across devices with phone-friendly charts and pinch to zoom.
Comparing a TradingView alternative for focused watchlists and simple alerts? Check two things: how the platform sources and labels forex data as real time versus delayed, and how reliably your watchlists and alerts sync to your phone without friction.
Alerts that do the watching for you
Alerts turn intent into execution without babysitting the screen. Decide the price or condition that changes your plan, then let software notify you. This reduces noise and helps you trade your process.
Practical alert playbook
- Mark levels. Prior day high/low, session open, yesterday’s close, and round numbers like 1.0700 on EURUSD. Note scheduled data times near those levels.
- Set proximity wisely. Place alerts a touch before or at the level. A 0.2 to 0.5 pip buffer on majors gives you time to assess spread and momentum without chasing.
- Use sequences. One alert for first touch, another for a confirmed break on close, a third for the retest. Turn off one-shot alerts that have served their purpose.
- Add context filters. Treat alerts differently during rollover or right before major data. You can mute or require a 1-minute close through the level during high-volatility windows.
- Decide the action. Predefine what you will check on trigger: spread, slippage risk, VWAP position, higher-timeframe level.
- Review outcomes. After the session, tag alerts that led to good trades versus noise. Refine buffers and conditions.
On TickerLists, you can click any price to set unlimited alerts or draw entry, stop, and target lines, drag to adjust them, and see P/L at each level. If you like a quick pre-trade gut check, the entry check analyzes today’s 1-minute chart to suggest an entry, a stop, a target, and the odds the target is reached first. Keep it as an input, not a rule.
EURUSD around the London open
About 10 minutes before the open, mark the Asian range. Place two alerts just outside the range edges. When the upper alert fires, check the spread and the 1-minute close. If the bar closes above the range and VWAP holds below price, consider a pullback entry with a stop back inside the range and a target at the next hourly swing. If the alert fires but the spread widens and price snaps back, stand aside and let the dust settle.
USDJPY during a headline spike
Keep USDJPY together with AUDJPY and EURJPY so you can see crossflows. Place alerts at recent intervention levels and at key round numbers. When a headline hits and the alert triggers, expect fast quotes and brief widening. Confirm with a 5-minute bar to avoid chasing the first spike. A second alert at the retest level can offer a cleaner entry if momentum resumes.
The bigger lesson in both examples is tool fit. You would not hunt for a math teacher without a directory geared for that job. In the same spirit, if you need subject-specific help, TutorListed is a straightforward way to find tutors by topic and place. Choose trading tools with the same focus on fit and signal.
Key takeaways
- Forex live quotes come from multiple liquidity sources and aggregation rules, so small differences across platforms are normal.
- Judge feed quality by median spread, update stability in fast markets, and how the feed behaves during rollover and news.
- Session timing drives liquidity and spread behavior. The London - New York overlap is the most active window, and rollover often widens spreads briefly.
- Match chart timeframe to your holding period. Use 1-minute streams for entries and higher-timeframe closes for bias.
- Structured watchlists and synced alerts keep focus on the right pairs at the right time, without babysitting the screen.
- Before choosing a platform, check how it labels real-time versus delayed data and how reliably mobile sync works.
FAQ
What are forex live quotes?
They are continuously updated bid and ask prices for currency pairs during the 24-hour trading week. Updates can be real time or delayed depending on the source.
Why do forex prices differ between platforms?
Each platform sources prices from different banks and liquidity providers and may add markups. Small differences in bid, ask, and spread are normal.
Are forex quotes truly 24/5?
Yes, from the Sunday open to the Friday close. Liquidity and spreads vary by regional session, with the London and New York overlap being the most active.
How fast is live forex data and what affects latency?
Under good conditions, updates arrive within milliseconds to a second. Network quality, vendor processing, and heavy news traffic can add short delays.
Do I need paid data for forex quotes?
Many retail forex feeds are available in real time through brokers or platforms. Some consolidated or multi-asset feeds may carry delays or require subscriptions.
More from the blog
Price-to-Earnings (P/E) Ratio: A Practical Guide for Traders
Learn what the P/E ratio shows, how to read it by sector and cycle, and how to view P/E beside live charts, alerts, and watchlists in TickerLists.
Company Profiles: What to Check Before You Trade a Stock
Read company profiles the right way. Scan key stats, tie them to live charts and news, and build a focused watchlist with alerts before you trade.
7 Ways to Trade Support and Resistance With Clean Levels
Learn 7 practical ways to trade support and resistance levels with clean zones, VWAP, price alerts, and simple plans you can apply on live charts.

How to Set Breakout Alerts That Actually Trigger on Time
Set breakout alerts that fire on time with precise levels, session-aware buffers, and live quotes across stocks, ETFs, futures, forex, and crypto.