7 Ways to Trade Support and Resistance With Clean Levels
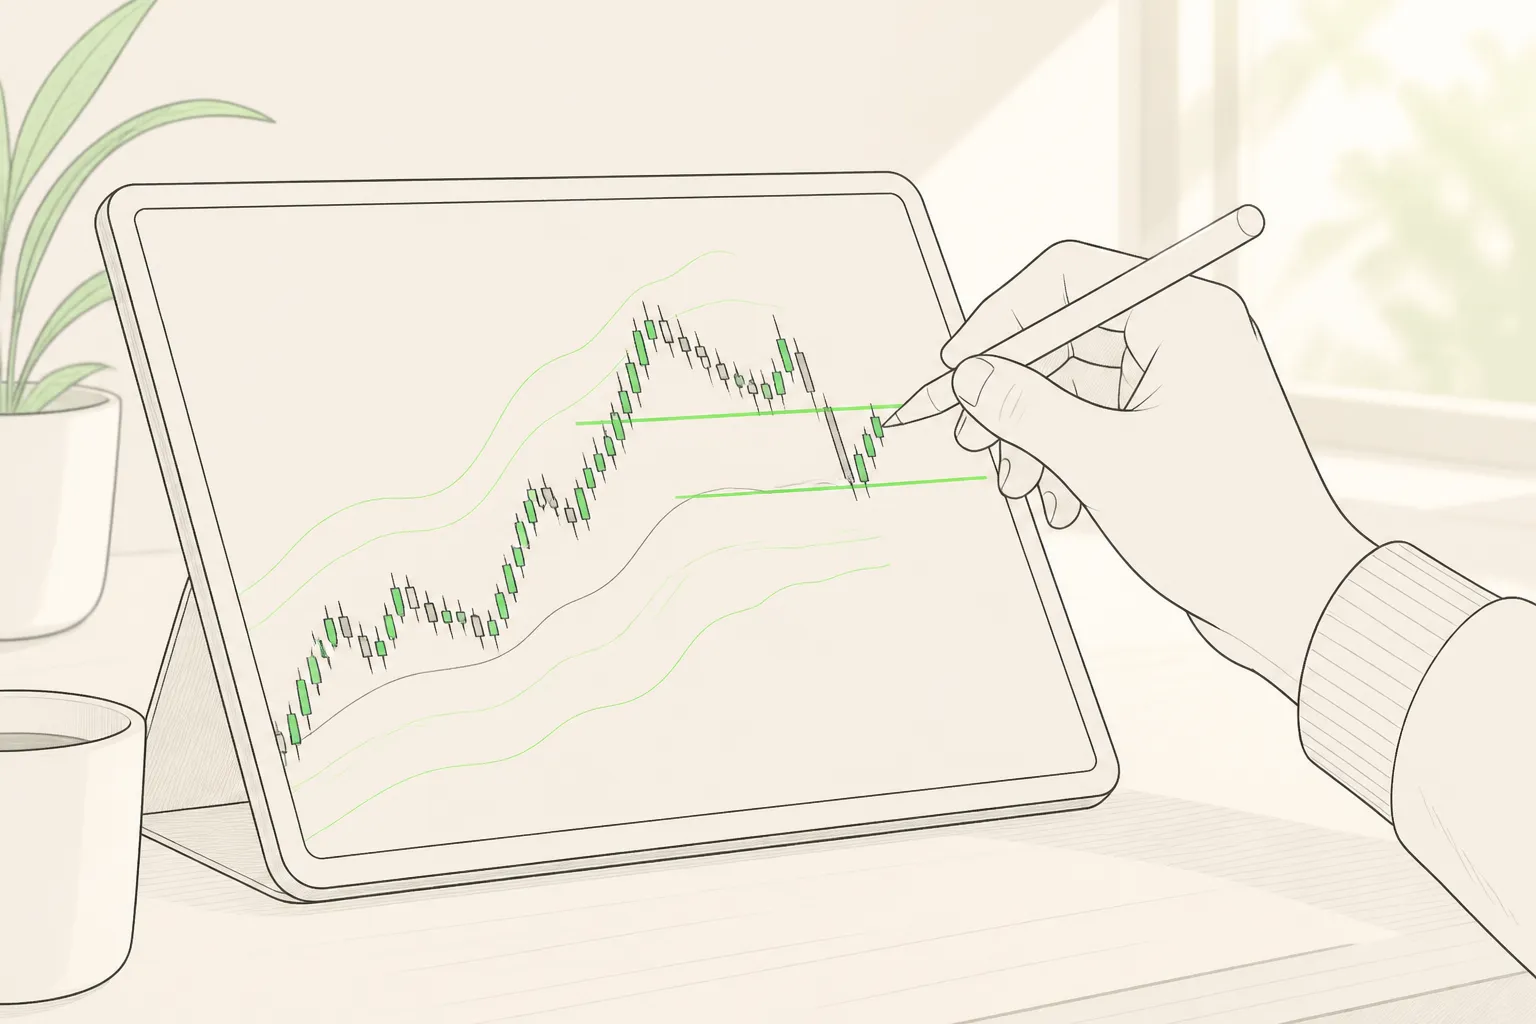
Most traders draw too many lines and still miss the ones that matter. The edge comes from a few clean levels that you trust, planned before price gets there, with rules for how you act. Use the playbook below to find better zones, add context, and execute without clutter.
1) Identify high-quality horizontal zones
Start with prior swing highs and lows. Look left and mark the most recent pivots that caused clear reactions. Add prior day high/low, prior week high/low, and any obvious multi-day range boundaries. Favor levels that produced sharp rejections, strong breaks, or repeated tags. These reflect where inventory changed hands.
Define zones, not single lines. Price often turns within a band. A simple rule is to use the wick extremes as the outer edge and the candle bodies as the inner edge. On intraday charts, size the band using a fraction of volatility, for example 0.25 x ATR(14) of your trading timeframe or 0.05% to 0.15% of price for large caps. On thinner names, widen the zone to account for slippage.
On TickerLists, flip between candlestick and line charts from 1-minute to weekly, and include extended hours when it matters. Use the draggable price axis to nudge zones into place. Keep only levels with proven relevance. If price has not respected a line in weeks or multiple touches now cut through it, hide it to reduce noise.
Example workflow: on a daily chart, mark the last two swing highs and the last swing low. Drop to the 60-minute to refine the zone edges. On the 5-minute, mark the prior day high/low and the opening range. You now have a tidy map that fits how most sessions trade.
2) Respect round numbers and gaps
Round numbers like 50, 100, 500, or forex big figures like 1.3000 often attract orders. Treat them as potential magnets and turning points. They carry more weight when they overlap a prior swing area or the top or bottom of a recent range. If a stock spends hours building under 100 and finally pushes through on volume, the 100 area is likely to act as support on a clean retest.
Gaps create levels at the gap open, the gap close, and the midpoint. Earnings gaps and major news gaps often get tested in the following sessions. Set alerts at the gap close to catch potential fills, and at the gap open to watch for rejections. Thin overnight gaps in futures or crypto can also turn into acceleration points during liquid sessions.
TickerLists shows company details, day and 52-week ranges, volume, market cap, P/E, the next earnings date, and the latest news. With live quotes including pre-market and after-hours for US stocks, you can see if an earnings gap is being faded before the bell and plan for a retest of the gap levels at the open.
3) Use VWAP and its bands as dynamic context
Session VWAP is a moving reference that many participants watch. On trend days, price often holds one side of VWAP and respects the bands. On rotational days, tags of VWAP and the inner band often set up mean-reversion entries back toward the center of the day’s auction.
Practical rules:
- If price is extended into a prior daily level and pushes beyond an outer VWAP band, look for exhaustion tells on lower timeframes for a fade back toward VWAP. Keep stops just beyond the extreme of the zone.
- On strong trend days, a pullback into VWAP or the inner band that aligns with a prior intraday level can be a continuation entry. Avoid fading the first pullback in the direction of the day’s trend.
- Measure extension. If your stock normally mean reverts when 1.5% above VWAP, note that threshold. Confluence beats hope.
Add VWAP with bands on TickerLists and watch how distance from VWAP lines up with your horizontal zones. Pinch-to-zoom on phone helps you judge whether tags are clean taps or messy overlaps before you commit.
4) Set alerts early and pre-plan the trade
You will miss clean trades if you wait to react. Place alerts before price gets there so you have time to decide. Use three alerts around a key level:
- Break: a few cents or ticks above resistance, or a small percentage like 0.05% for high-priced names.
- Retest: right at the level to cue a pullback entry from the other side.
- Failure: just back inside the prior range to flag a false break.
In TickerLists, click any price to set unlimited alerts at your chosen level. They save to your account and sync across devices, so your plan follows you on desktop or phone. Because quotes include pre-market and after-hours for US stocks, you can catch early moves and prepare for the open without staring at the screen.
Good levels are only half the job. Decide how you will trade them before price arrives. Define entry, stop, and target. For a breakout, a common plan is entry on the first 1-minute close above the level, stop just back inside the range or below the candle that broke it, and first target at the next obvious zone. Aim for a minimum 2R reward to risk. Plan partials, for example sell one-third at 1R, move stop to break-even, then trail under higher lows or a moving average.
With TickerLists, draw entry, stop, and target lines directly on the chart, drag to refine them as price develops, and see the P/L at each level. If you trade fast timeframes, use the one-button entry check on today’s 1-minute chart to get a suggested entry, stop, target, and the odds the target is reached first. Treat those odds as context, not certainty, and size position risk to a fixed amount per trade.
5) Build confluence and keep a clean process
Levels have more bite when multiple signals overlap. A daily supply zone that caps 5-minute candles, sits near session VWAP, and aligns with a round number is stronger than a lone intraday line. Seeing that stack in real time builds conviction and keeps you from forcing trades in the middle of nowhere.
Use TickerLists multi-chart layouts to display one, two, or four charts at once. A practical view is daily and 60-minute on top, with 5-minute and 1-minute below. Scroll and zoom each panel to align reactions around the same prices. Because TickerLists covers stocks, ETFs, indices, futures, forex, and crypto, you can also check related markets. If a stock is testing support while its sector ETF and the index both lose their levels, treat bounce attempts with more caution than if all three are basing together.
Clean execution comes from a clean list. Keep a running watchlist organized by setup quality and catalyst. In TickerLists, create sections such as A-setups, Retest candidates, and Earnings gaps. Drag to reorder as conditions change and sort columns to surface what is moving now. Quick-switch with one key to jump between sections when the market picks up.
Review every level you traded. Save a before-and-after screenshot, tag the reason you took the trade (break, retest, VWAP confluence), note the catalyst, and record R-multiple outcome. Over a month, you will see which levels and entry types pay you and which to avoid. If you are moving from another platform, import TradingView exports with sections to get started fast. Lists, alerts, levels, and layouts save to your account and sync across devices, so your prep is always with you.
A simple checklist improves consistency. Borrow the mindset from ecommerce website development, where budgets and scope are mapped step by step. For a clear, step-by-step model, see Website design pricing in Ireland: a practical cost checklist, and adapt that structure to codify your entry, stop, target, and review steps.
Put it together and keep it simple. Define your zones, respect round numbers and gaps, add VWAP context, set alerts ahead of time, and write down how you will trade the level. Then review the outcome and clean up your lists so the next decision is easier. TickerLists supports that loop with live charts, price alerts, saved layouts, and organized watchlists across stocks, forex, futures, and crypto.
Key takeaways
- Mark prior highs and lows as zones and prune levels that lost relevance.
- Round numbers and gap open/close levels often matter, especially in confluence.
- Use VWAP and its bands to judge extension, mean reversion, and trend continuation.
- Set alerts for the break, retest, and fail, and pre-plan entry, stop, targets, and partials.
- Multi-timeframe layouts, related-market checks, and a tagged journal build conviction and consistency.
FAQ
How do I know if a support or resistance level is strong?
Look for multiple reactions at the same area across timeframes, high volume on turns, and alignment with other factors like VWAP bands or round numbers.
Should I trade a level on the first touch or wait for a retest?
Both can work. First touches are cleaner but faster. Retests give confirmation but may offer worse price. Define the trigger you prefer and stick to it.
How can I avoid drawing too many lines on my chart?
Limit yourself to recent swing highs and lows, key round numbers, and one or two dynamic references like VWAP. Hide levels that price has ignored.
What timeframes are best for trading support and resistance?
Use a higher timeframe to define major zones, then a lower timeframe for timing. For example, daily for zones and 5-minute or 1-minute for entries.
Can I use support and resistance on crypto and forex too?
Yes. The same principles apply. Mark prior highs and lows, note round numbers, and watch VWAP behavior. Adjust for each market’s typical volatility.
More from the blog

How to Set Breakout Alerts That Actually Trigger on Time
Set breakout alerts that fire on time with precise levels, session-aware buffers, and live quotes across stocks, ETFs, futures, forex, and crypto.
Best Charting Platforms for Watchlists, Alerts, and Layouts
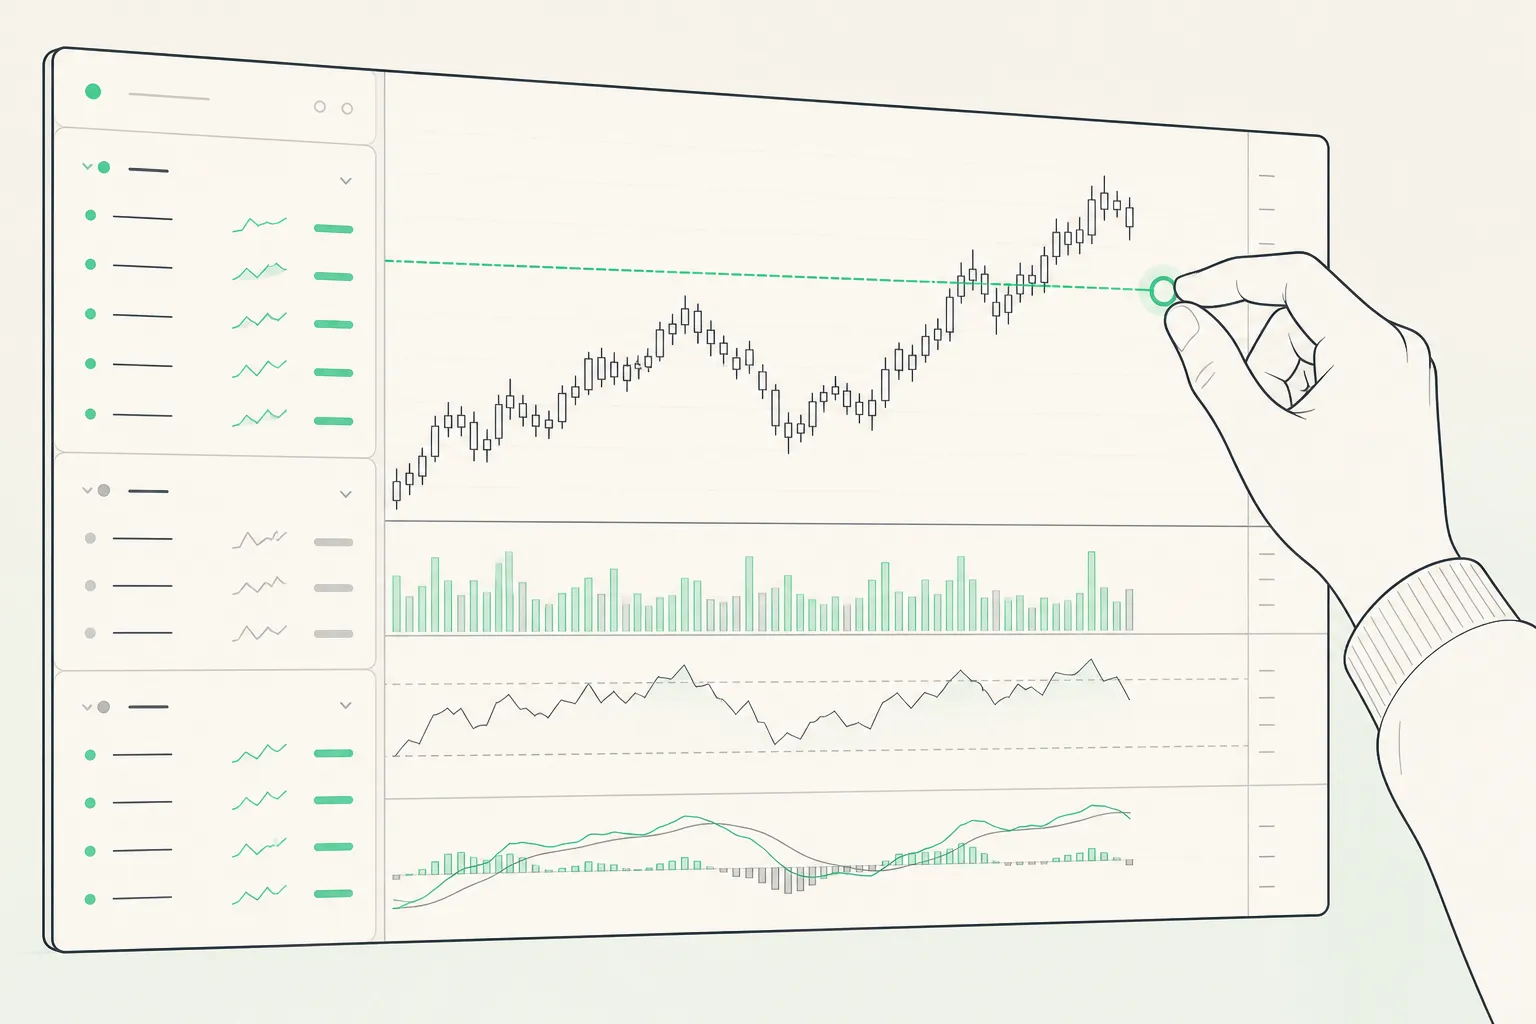
Compare top charting platforms for fast watchlists, live charts, and price alerts. Get latency tips and a 7-day checklist to import and test your lists.
TradingView vs TickerLists: Watchlists, Charts, and Alerts
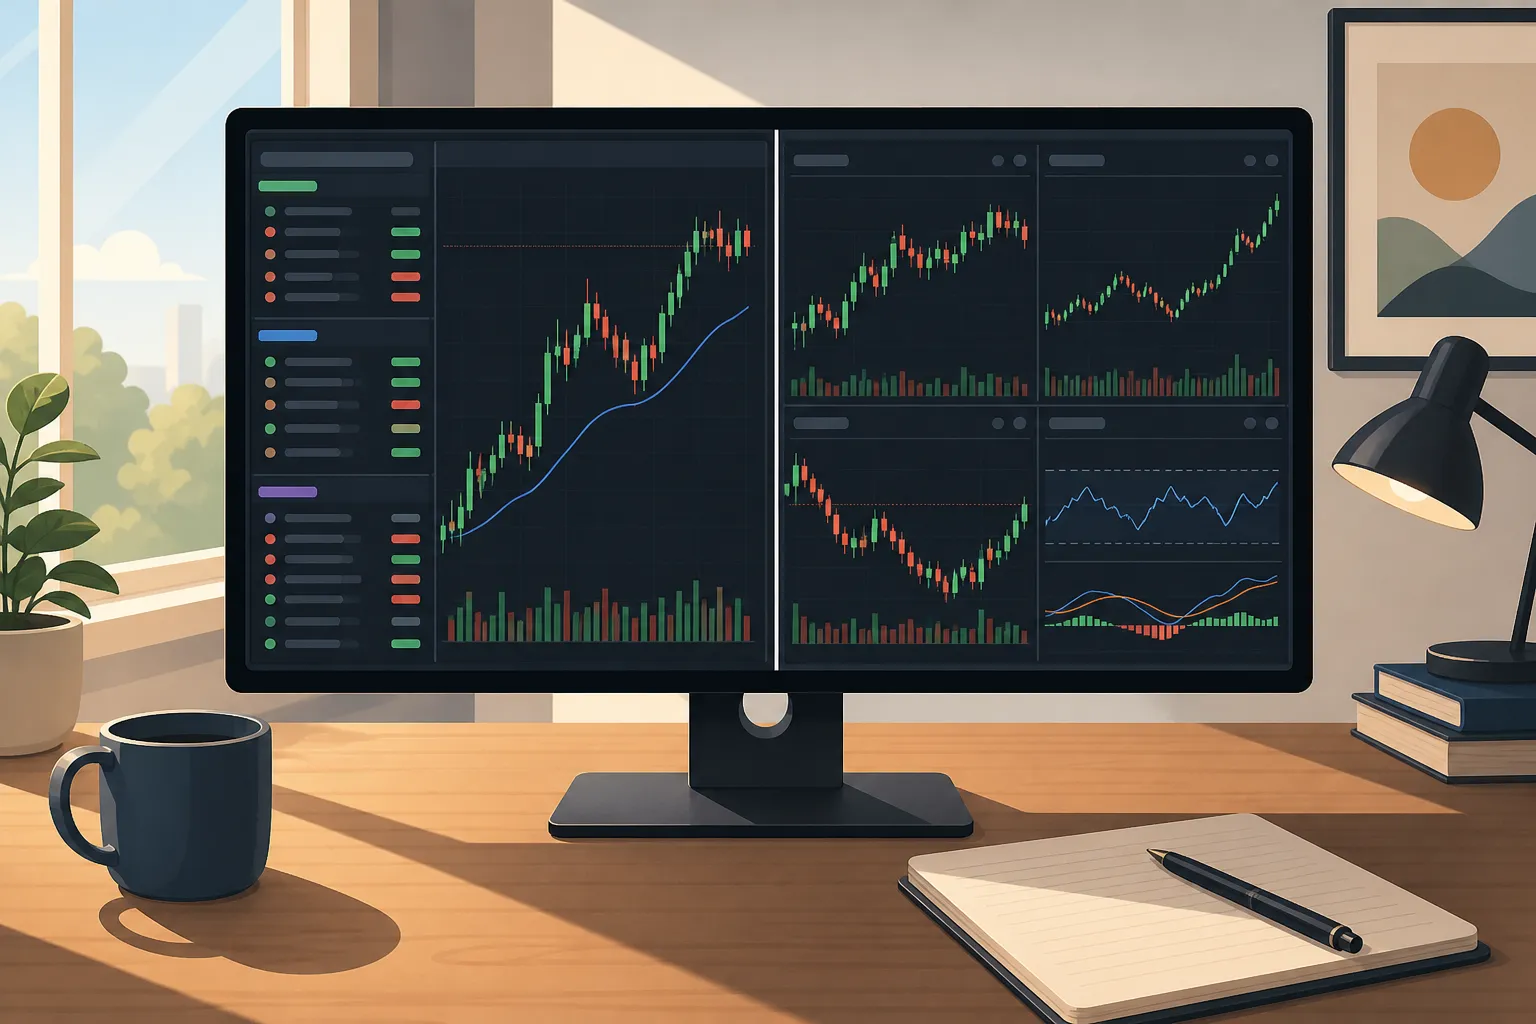
TradingView vs TickerLists: compare watchlists, live stock charts, price alerts, VWAP, and layouts. Learn who each suits and how to migrate fast.

Best TradingView Alternatives for Live Charts and Watchlists
Compare fast watchlists, real-time quotes, alerts, and latency across TradingView alternatives, plus how to import TradingView lists into TickerLists.