4 Multi-Timeframe Chart Layouts Traders Use Every Day
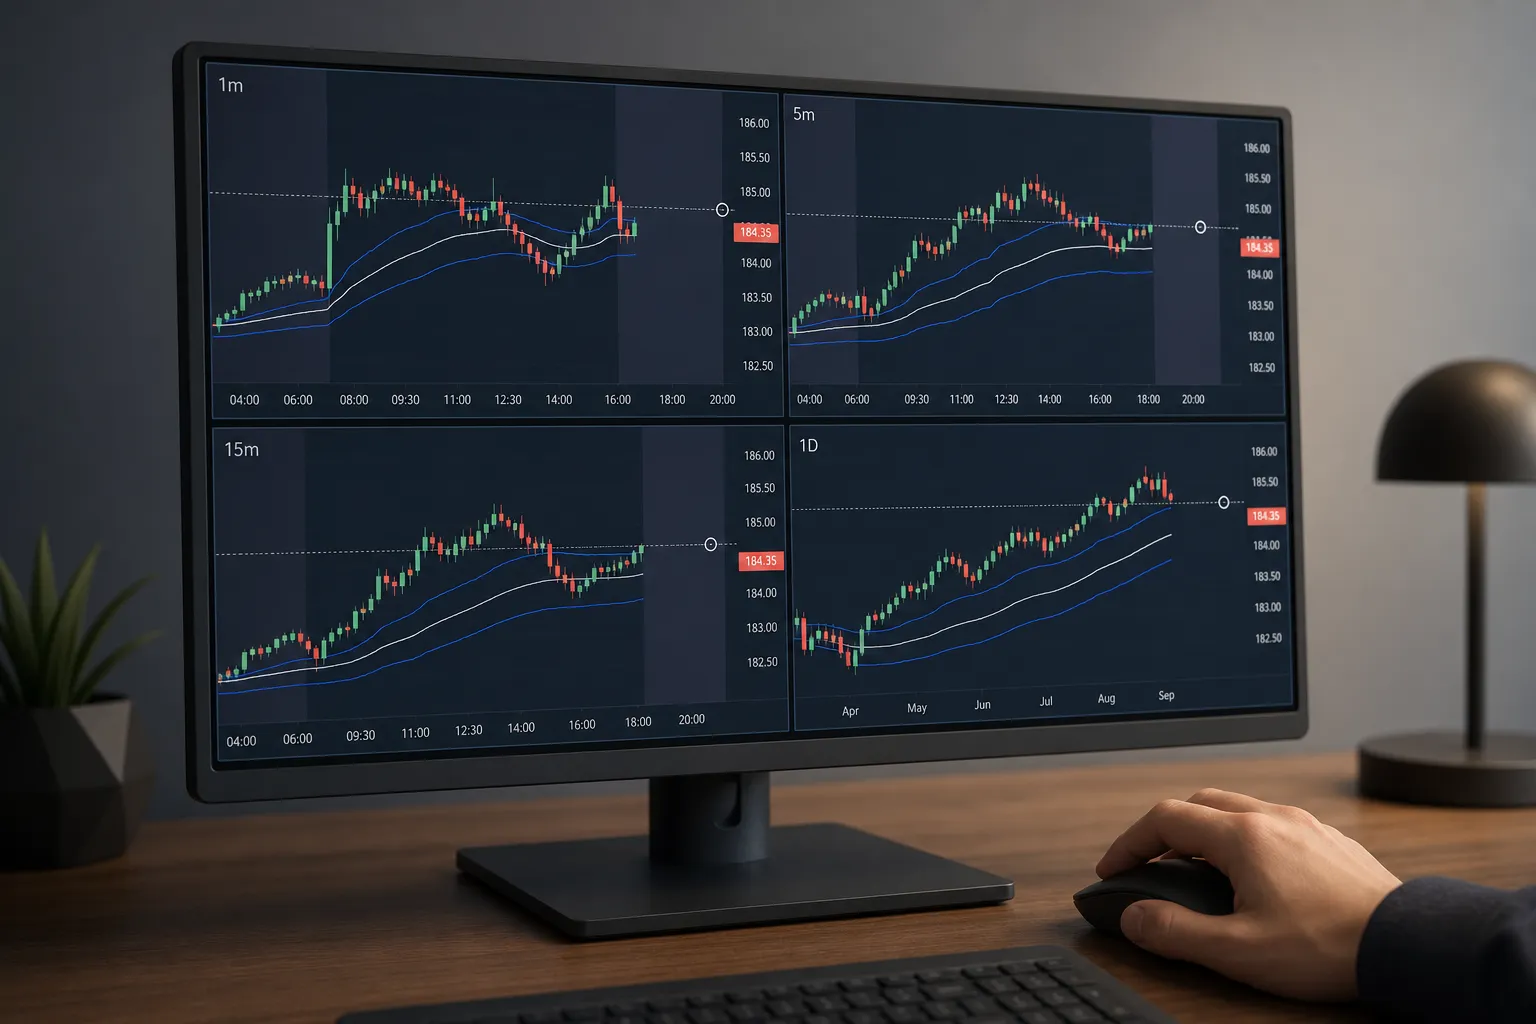
Clicking through tabs costs fills. By the time you confirm the daily trend, the scalp is gone. Multi-timeframe layouts put entry timing and bigger-picture risk on one screen so you decide faster with fewer second guesses. The four builds below are practical, repeatable, and easy to set up with one, two, three, or four charts in TickerLists.
1. Scalper: 1-minute, 5-minute, 15-minute, daily
This four-panel view catches fast moves while the daily keeps you from fighting trend or hidden levels. The 1-minute handles entries, the 5 and 15 filter noise and define structure, and the daily sets bias and risk lines.
How to set it up
- Select the four-chart layout. Set panels to 1-minute, 5-minute, 15-minute, and daily candlesticks.
- Turn on extended hours for intraday panels if you trade pre-market or after-hours. Quotes include those sessions for US stocks.
- Add VWAP with bands to the 1- and 5-minute charts to anchor entries. The center line shows where most volume transacted; the bands frame stretches and snaps.
- Click any price to drop stock price alerts at the pre-market high, opening range high/low, and your planned stop. Drag lines to fine-tune and see P/L at each level before you commit.
- Save the layout so it loads on every ticker. Lists, alerts, levels, and layouts sync across devices with phone-friendly charts and pinch-to-zoom.
Why traders use it
- The 1-minute shows the tape’s rhythm. Use it to time higher-low or lower-high pivots into VWAP or prior highs/lows.
- The 5- and 15-minute smooth chop. If a 1-minute pullback holds above the 5-minute swing low and VWAP, odds favor continuation over reversal.
- The daily prevents fading strong trends and flags nearby gaps or 52-week levels you must respect.
- If you want a quick confidence check, the Entry check and odds button analyzes today’s 1-minute chart and suggests an entry, stop, target, and the odds the target is reached first.
Example playbook
- Opening drive continuation: Pre-market high is 102.40 on the daily uptrend. Alert at 102.40. On the 1-minute, price reclaims VWAP and pushes through 102.40. Entry on the first higher low above 102.40. Stop a few cents below the reclaim candle or below the 5-minute swing low. First target at a measured move equal to the opening range height.
- VWAP fade back to range: Stock spikes 1% above prior day’s high, stretches to the outer VWAP band, then rejects. Short on a 1-minute lower high that also loses VWAP. Cover into the midpoint of the opening range. If the 15-minute trend stays up, size down or keep it to a scalp.
2. Swing: 15-minute, hourly, daily, weekly
Swing entries work best when structure is clean. This stack shows intraday rhythm for precision, multi-day swings for follow-through, the daily base or breakout, and the weekly trend that often decides if a move extends or fails.
How to set it up
- Use the four-chart layout. Set panels to 15-minute, hourly, daily, and weekly candlesticks.
- Keep VWAP with bands on the 15-minute for pullback entries inside a larger move. Leave the daily and weekly uncluttered to read ranges, gaps, and higher-timeframe trend.
- Place alerts at your daily trigger, invalidation level, and first target. You can set unlimited alerts and adjust them by dragging.
- Save as a layout named Swing. One key switches layouts, and one key quick-switches tickers from your watchlist.
How to work it
- Daily trigger with weekly support: A daily base tightens under a prior high while the weekly shows higher lows. Alert at the daily breakout and at the invalidation low of the base. Enter on the break, risk to the base low, target the next clear daily level. If the weekly trends in your favor, let a runner trail under higher lows.
- 15-minute pullback in trend: On the hourly, a swing up leg pauses. The 15-minute returns to VWAP and holds. Entry on the first 15-minute higher low with risk a few cents below that low. Confirm the daily is not pressing into obvious resistance from recent gaps.
- Review cadence: At the open, scan hourly for clean swings. Midday, manage around the 15-minute. After the close, use the daily and weekly to decide what stays on the list.
Working the list
- Build a sector-based workflow using watchlists with sections. Create unlimited lists, up to 200 symbols each, and fold sections like Tech, Energy, and Industrials.
- If you manage a crypto watchlist or follow forex and futures, this same layout works. Market coverage spans stocks, ETFs, indices, futures, forex, and crypto, and market data is real-time or delayed depending on the exchange.
- If you are moving from another platform and want a simple TradingView alternative for lists and layouts, import your TradingView exports. Sections carry over, so your organization stays intact.
3. News: Pre-market, regular hours, after-hours
Earnings, guidance, or a headline can reset price discovery. This layout tracks how price behaves across sessions so you can measure gap reaction, opening drive, and late repricing without losing continuity.
How to set it up
- Pick a three- or four-chart layout. Set intraday panels to 1- or 5-minute candlesticks with extended hours on.
- Zoom the first panel to pre-market, the second to regular hours, and the third to after-hours. Use the fourth panel for a daily chart to anchor the gap against prior ranges.
- Drop stock price alerts at the pre-market high/low, the open, and any key daily levels you plan to trade against. Drag to adjust as the story develops.
Execution notes
- Classify the gap on the daily: breakaway into clear air, continuation within trend, or into a likely fill zone. Your plan depends on that context.
- Use VWAP on the regular-hours panel to judge acceptance. Holds above VWAP with higher lows show demand absorbing supply. Rejections back below VWAP after a spike warn of a fade.
- Mind session transitions. A strong pre-market bid that vanishes at the bell often leaves a vacuum to VWAP or the pre-market low. Keep alerts there so you do not chase.
- Because lists, alerts, and layouts sync across devices, you can track the same story on your phone between sessions with live stock charts and a draggable price axis.
Example
- Earnings gap up 6% into a prior daily range. Pre-market high sets at 48.20. First five-minute bar fails to push through, pulls to VWAP, then reclaims. Entry on the reclaim with risk below the VWAP candle low. If price cannot hold over VWAP into the first 30 minutes, cut it and wait for a base or the fill.
4. Trend: Daily with VWAP and weekly context
For adds and alignment, two timeframes beat five. A daily chart with VWAP and bands keeps you honest on pullbacks, while a weekly chart confirms whether you are trading into or with the dominant slope.
How to set it up
- Open the two-chart layout. Left panel daily candles with VWAP and bands on. Right panel weekly candles.
- Scroll and zoom the weekly to show two to five years of history. Drag the price axis on the daily to focus on the current swing.
- Set alerts a few cents below your daily stop and just under weekly higher-low structure. Save the layout as Trend to reuse on every symbol.
When to pick this view
- Adding on breakouts that pull back to daily VWAP while the weekly trends up and prints higher lows.
- Filtering false strength. If the daily pops on light news but the weekly sits under a clear shelf of resistance, size down or pass.
- Applies across markets. ETFs, indices, and crypto all map well to this clean two-panel read.
Example add plan
- Weekly uptrend with a shallow three-week consolidation. Daily pulls to VWAP and holds. Add on the first daily higher low that prints above VWAP with risk a few cents under that pivot. If the weekly then takes out the prior swing high, trail below weekly higher lows.
Workflow tips that make layouts pay
- Save separate layouts for Scalp, Swing, News, and Trend. One key quick-switch lets you test a ticker through each lens in seconds.
- Keep watchlists lean. Use sections for A-setups and backups, and archive crowded lists. You can paste a list of symbols or type to add on the fly.
- Treat alerts like a checklist: entry, stop, target. Click any price to add them, then drag to update as price evolves. The P/L readout at each level keeps risk real.
- If your team standardizes systems to move faster, copy that mindset. RedStudio builds reusable website components to speed delivery. Do the same with repeatable chart layouts and rules.
- Name layouts clearly and keep the chart order consistent so your eye lands on the right panel without thinking.
Multi-timeframe charts are less about fancy tools and more about repeatable discipline. TickerLists gives you candle or line charts from 1-minute to weekly bars, VWAP with bands, live quotes with extended hours for US stocks, alerts and trade levels you can drag, and multi-chart layouts you can save and sync. Build the four views above, keep them consistent, and your decision time will shrink while your read of context improves.
Key takeaways
- Use fixed multi-timeframe charts for scalps, swings, news, and trend alignment.
- Four-panel scalps and swings, three-plus-one for news, and a two-panel daily-weekly trend view cover most needs.
- Add VWAP with bands on intraday or daily charts to judge pullbacks, stretches, and acceptance.
- Save layouts, organize watchlists with sections, and quick-switch tickers to move faster.
- Set and drag stock price alerts at entries, stops, and targets to keep risk and plans visible.
FAQ
What are multi-timeframe charts and why should I use them?
They show the same ticker across different timeframes at once, so you can judge entries and risk with both short-term signals and higher-timeframe context.
How do I build multi-timeframe layouts in TickerLists?
Choose one, two, or four charts, set each panel’s timeframe, add VWAP if needed, and save the layout. You can quick-switch layouts and tickers from watchlists.
Can I set stock price alerts for my levels?
Yes. Click any price to set unlimited alerts, or draw entry, stop, and target lines and drag to adjust. You will see P/L at each level as you move them.
Does TickerLists work for crypto and forex too?
Yes. You can track stocks, ETFs, indices, futures, forex, and crypto, with real-time or delayed data depending on the exchange.
Can I import my TradingView watchlists?
Yes. Import TradingView exports with sections so your watchlist organization carries over. You can also paste a list of symbols to add quickly.
More from the blog
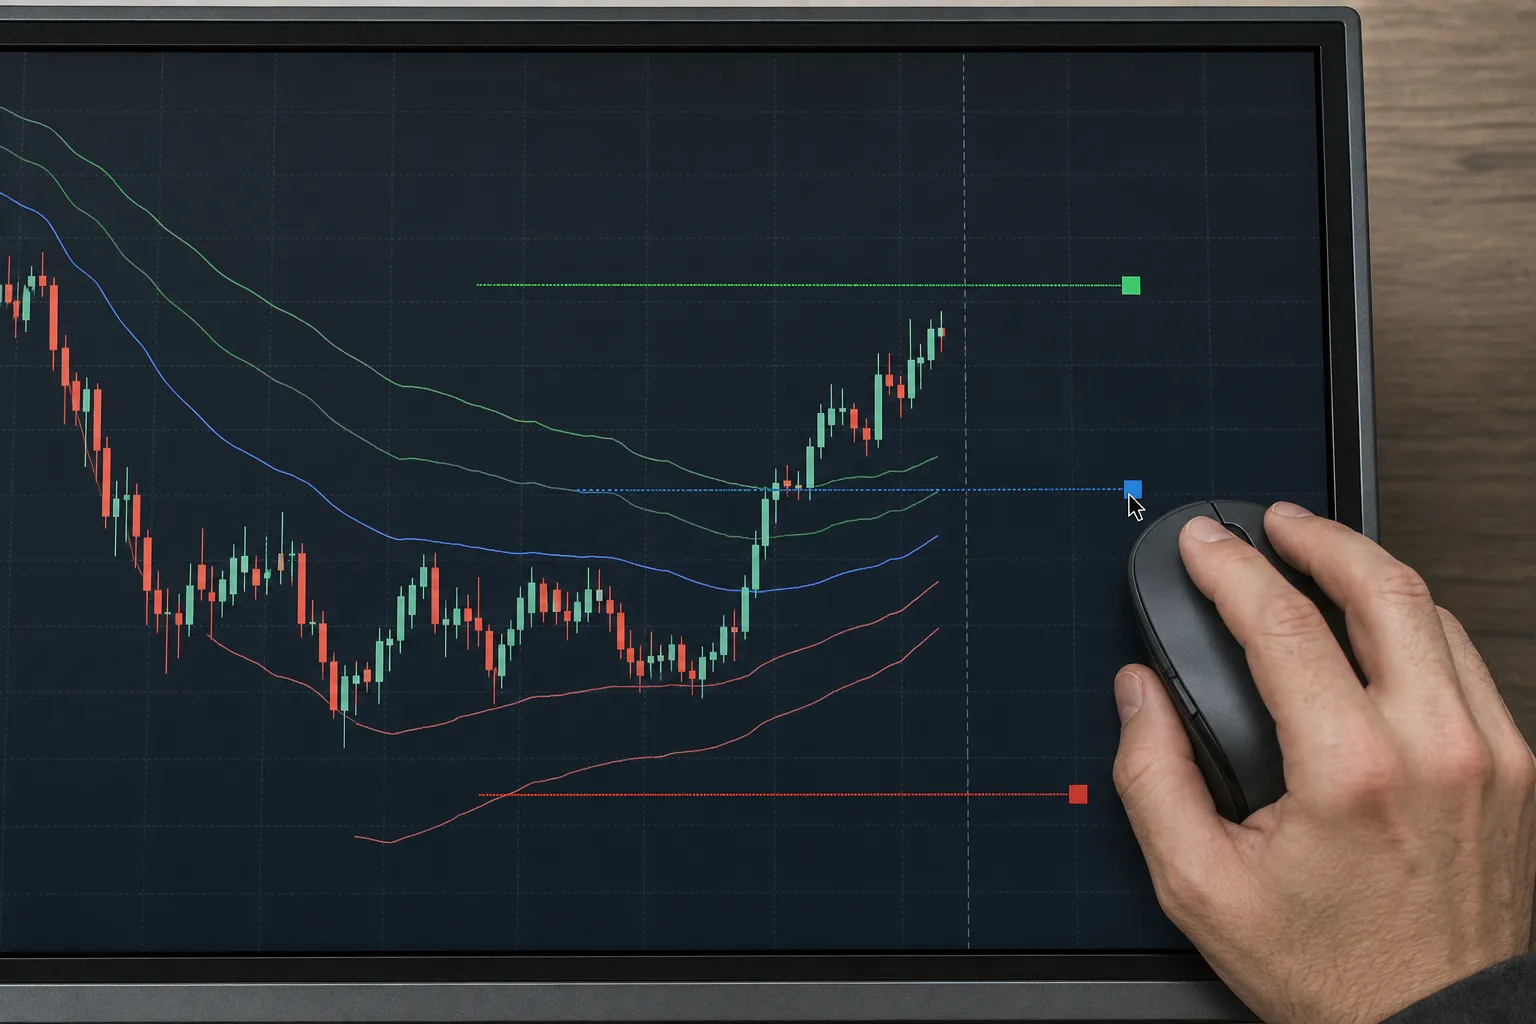
Drawing Tools for Traders: Levels, Alerts, and VWAP Bands
Mark entries, stops, targets, set price alerts, add VWAP bands, and save synced layouts with TickerLists live charts for stocks, futures, forex, crypto.
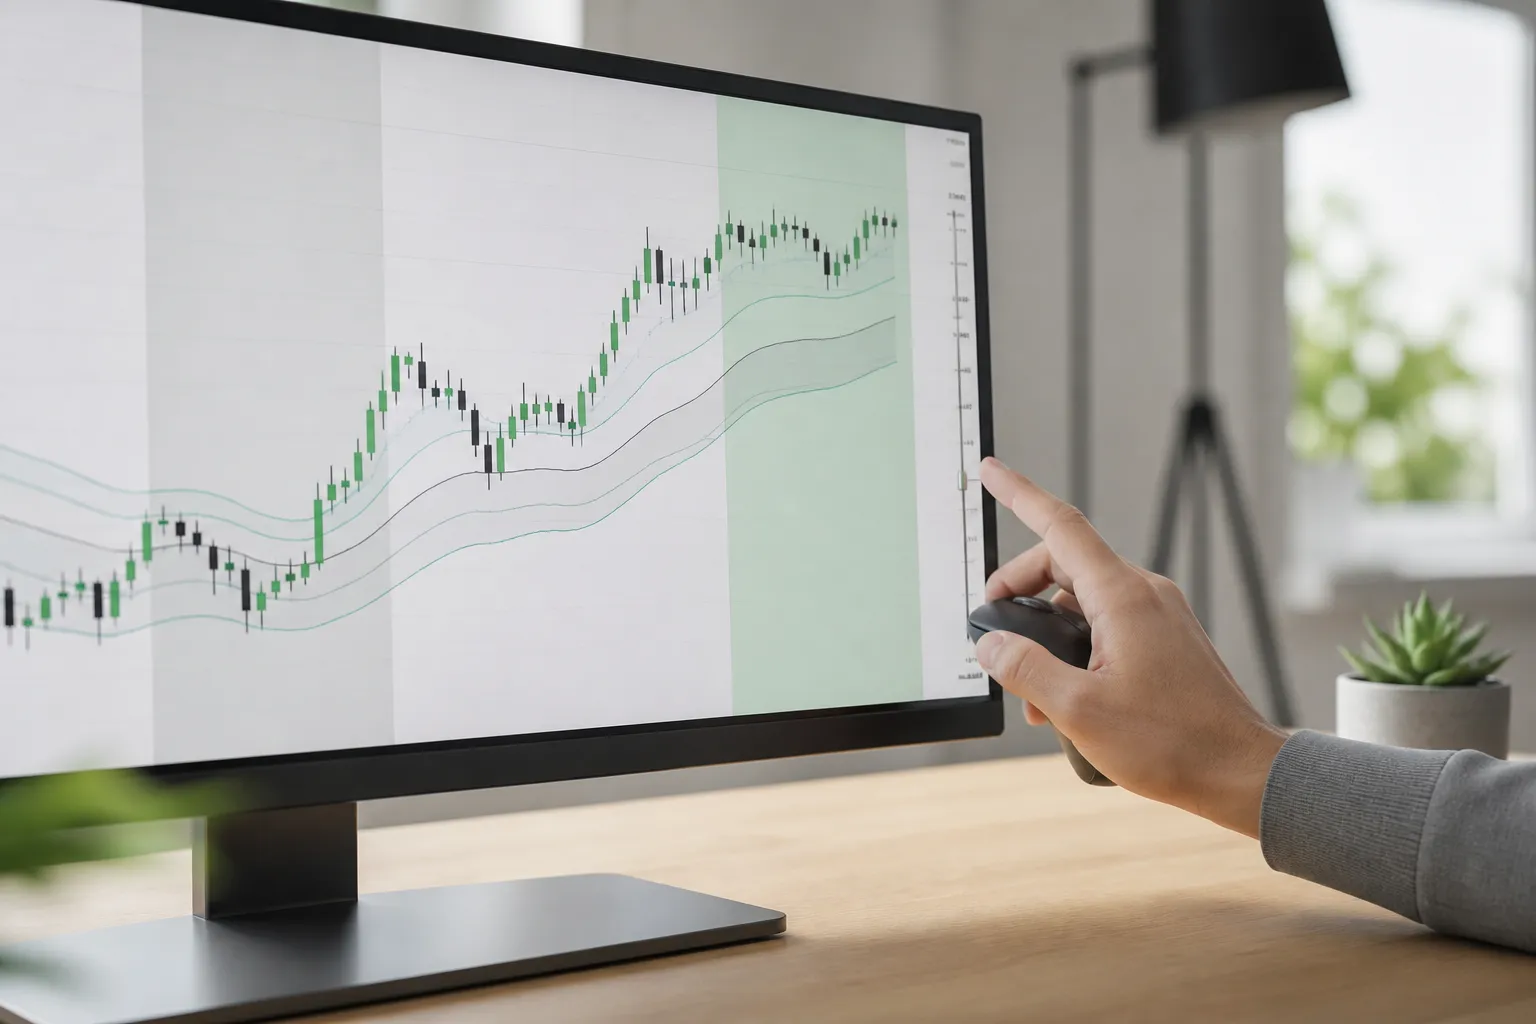
Live Stock Charts With Real-Time Candles and Extended Hours
See real-time stock charts with pre-market and after-hours, clear timeframes, and practical reads for gaps and levels. How TickerLists handles sessions.
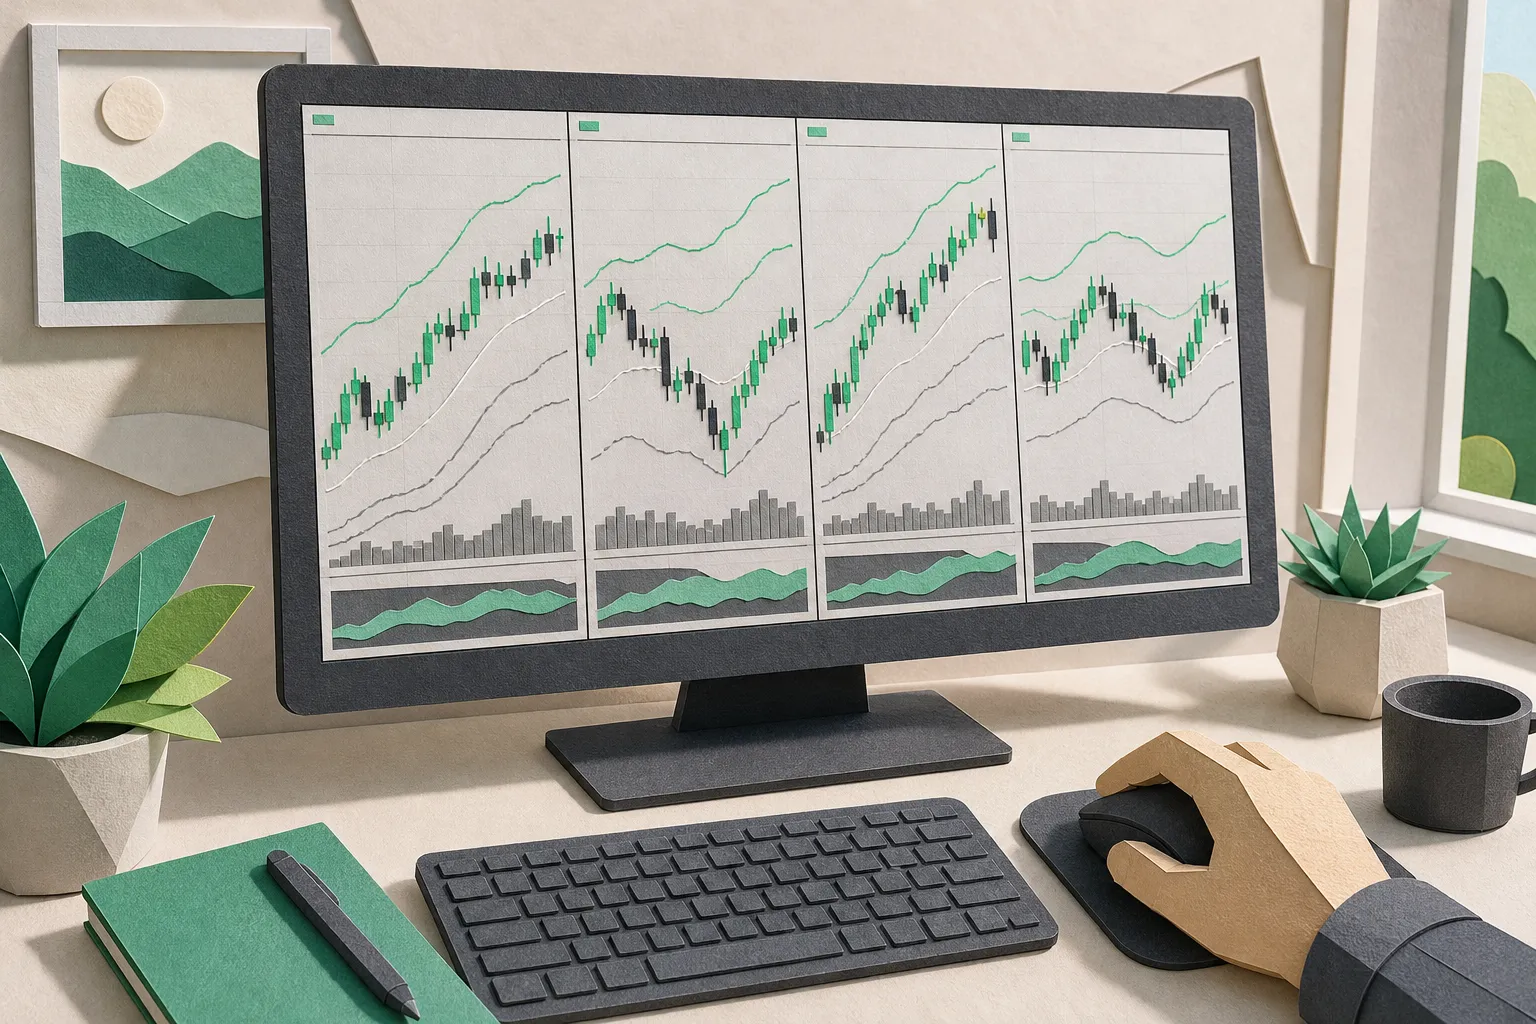
Index Charts That Matter: S&P 500, Nasdaq, Dow with VWAP
Read index charts the right way. Use VWAP, layouts, watchlists, and alerts in TickerLists to track the S&P 500, Nasdaq, and Dow with speed and clarity.

Forex Live Quotes: Sources, Latency, Sessions, and Alerts
See how forex live quotes are sourced, what latency to expect by session and connection, and how to track pairs with watchlists and synced price alerts.